Viz-a-day-2
news
code
analysis
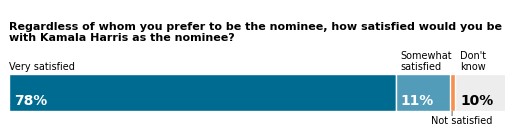
Day two was another horizontal percentage stacked bar. They’re trickier than they look. This one is from the NYT.
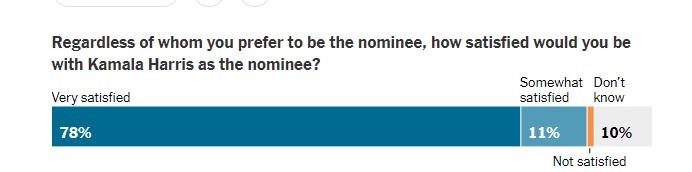
Here’s my code. Pretty close. I need to work on font matching.
import pandas as pd
import matplotlib as mpl
import matplotlib.pyplot as plt
import numpy as np

y = 0
very = 78
some = 11
nots = 1
dont = 10
fig, ax = plt.subplots()
ax.broken_barh([(y, very), (very, very+some), (very+some, very+some+nots), (very+some+nots, very+some+nots+dont)], [10, 9], facecolors=('#006b91', '#529cb9', '#f7904d','#ededed'), edgecolor='white')
ax.set_ylim(-40, 50)
ax.set_xlim(0, 100)
ax.spines['left'].set_visible(False)
ax.spines['bottom'].set_visible(False)
ax.spines['top'].set_visible(False)
ax.spines['right'].set_visible(False)
ax.set_yticks([])
ax.set_xticks([])

ax.text(1, 11.5, "78%", fontsize=10, color='w', weight='bold')
ax.text(79, 11.5, "11%", fontsize=10, color='w', weight='bold')
# ax.text((very+some+nots)+2, 14.5, "1%", fontsize=8)
ax.text(91, 11.5, "10%", fontsize=10, weight='bold')
ax.text(0, 20, "Very satisfied", fontsize=7)
ax.text(79, 20, "Somewhat\nsatisfied", fontsize=7 )
ax.text(85, 7, "Not satisfied", fontsize=7)
ax.text(89, 9, "|", fontsize=4, weight='bold')
ax.text(91, 20, "Don\'t\nknow", fontsize=7)
ax.text(0, 27, "Regardless of whom you prefer to be the nominee, how satisfied would you be\nwith Kamala Harris as the nominee?", fontsize=8, weight='bold')

plt.show()
Which yielded this.