Interstate Migration Flows
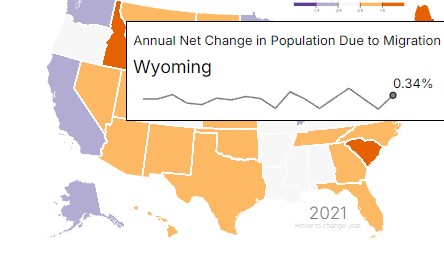
To interrogate a narrative that Americans are fleeing certain states due to political climate or tax status, I made a dynamic map with javascript and D3 to show 17 years of net annual and total percentage population change due to interstate migration using the Census Bureau’s American Community Survey migration flow estimates. The total net population change due to migration after 17 years is displayed in a tooltip. I recorded an Excel macro to munge the data inside the ACS provided spreadsheets. - link-
Transmission Line Inspector
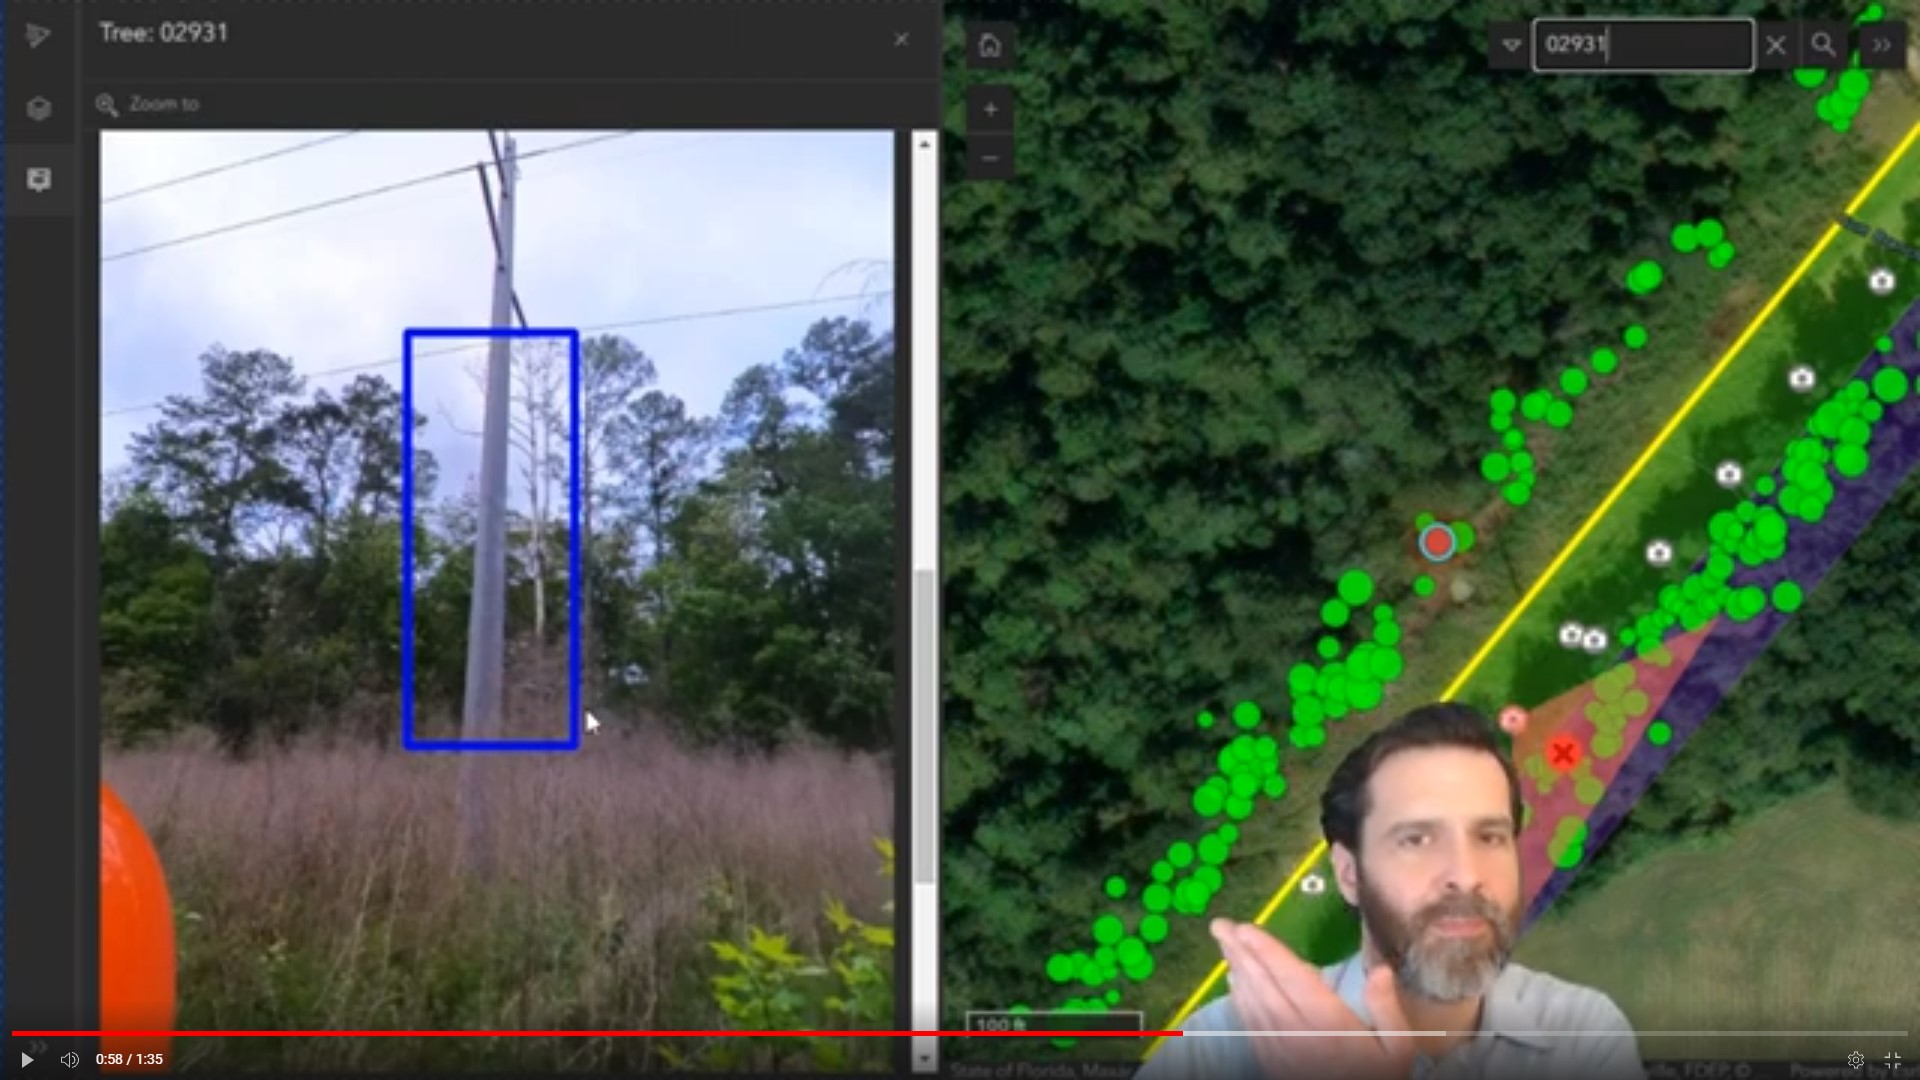
I built a tool to visualize potential tree strike areas and inspect tree health along high-voltage power lines. The tool employs 360° equirectangular imagery displayed via ESRI’s new Oriented Imagery viewer in ArcGIS Online. Trees identified as potential hazards can be examined by the client from multiple viewpoints in order to ascertain whether additional field inspection is warranted. - link to youtube demo -
Redistricting Plan Scorer to Compare Compactness, Contiguity, Partisan Fairness, and Population Equality
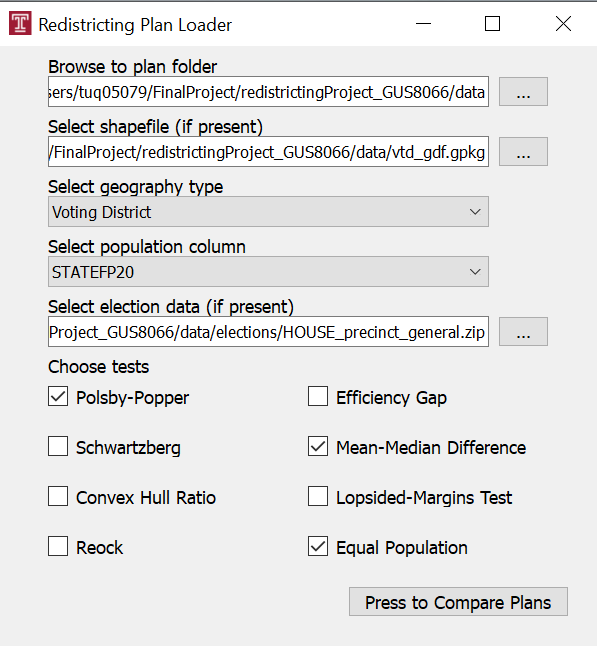
In GIS App Development, our two-person team built a tool to score proposed congressional redistricting plans on several state legislature and Constitutionally-mandated criteria, including population equality, compactness, and partisan fairness. I coded the GUI in pyQT5 and was responsible for the partisan fairness tests.
Analysis of Atmospheric River Effects in California 2023 Using LANDSAT and Sentinel-1
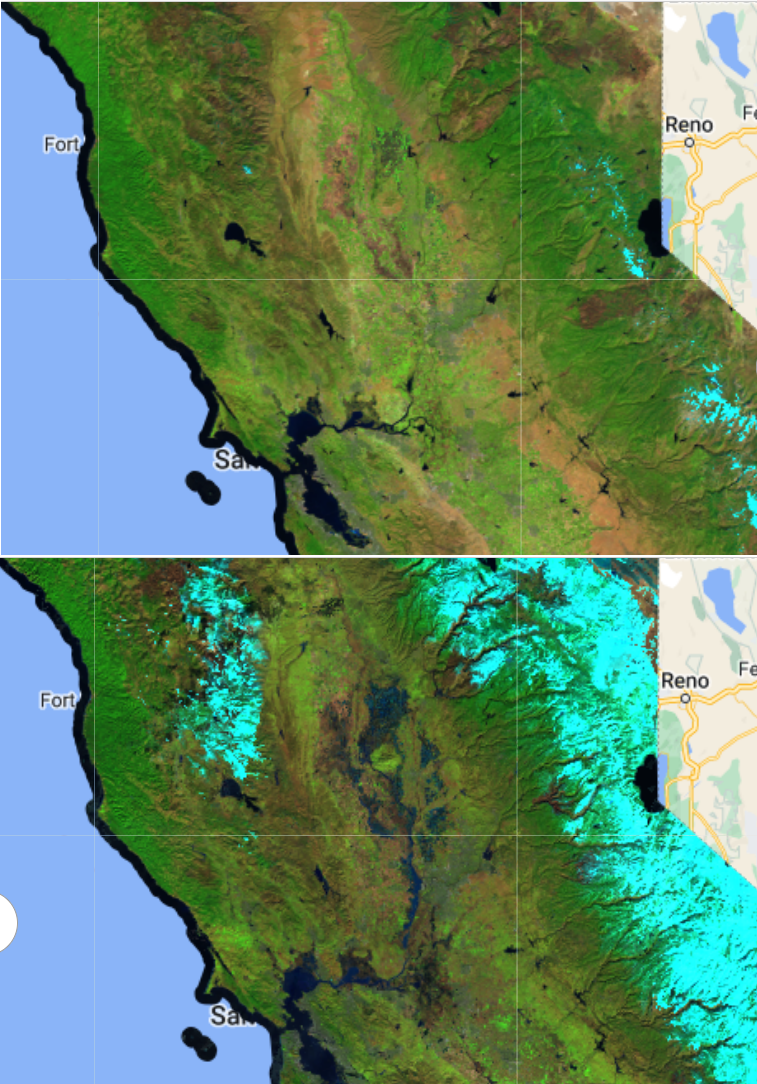
I studied the effects of an “atmospheric river” in early 2023 that left at least 23 people dead in California. The analysis was conducted using Python, Google Earth Engine, the geemap module, and jupyter notebooks. Normalized Difference Water Index (NDWI) using LANDSAT imagery and Synthetic Aperture Radar (SAR) data from Sentinel-1 were used to calculate standing water left by the event.
Machine Learning Land-use Classification in scikit-learn
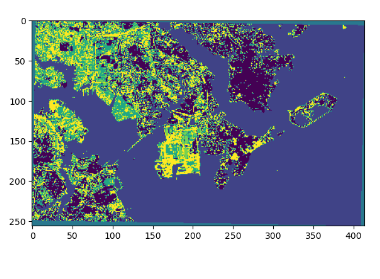
I created satellite imagery labels and and trained a machine learning model to classify land use in Baltimore. In this first iteration, the goal was to distinguish between high and medium density residential housing.
Using Building Renovation Permit Applications as Leading Indicators for Property Crimes
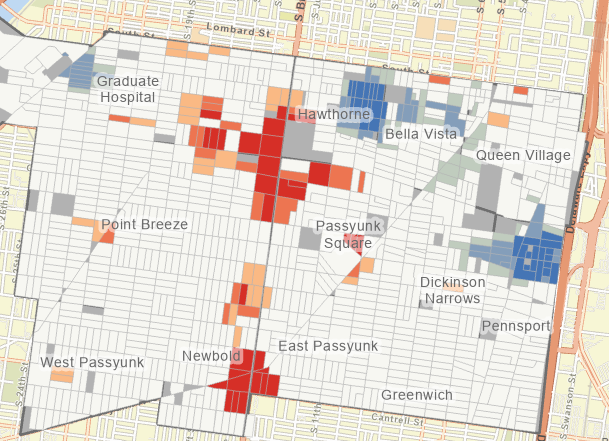
In another analysis, I looked for correlations between the number of building renovation permits filed with Philadelphia’s Department of Licenses and Inspections and the frequency of reported property crimes in several South Philadelphia neighborhoods. I was interested to see whether new permit filing for residential construction and renovation associated with gentrification could be used as a leading indicator of crime reports.
Predicting the Alabama State Constitutional Amendment Vote
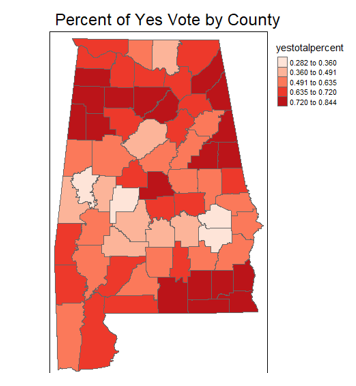
In another project, I built a multivariable regression model in R to predict the election outcome of a ballot initiative that amended the Alabama State Constitution.
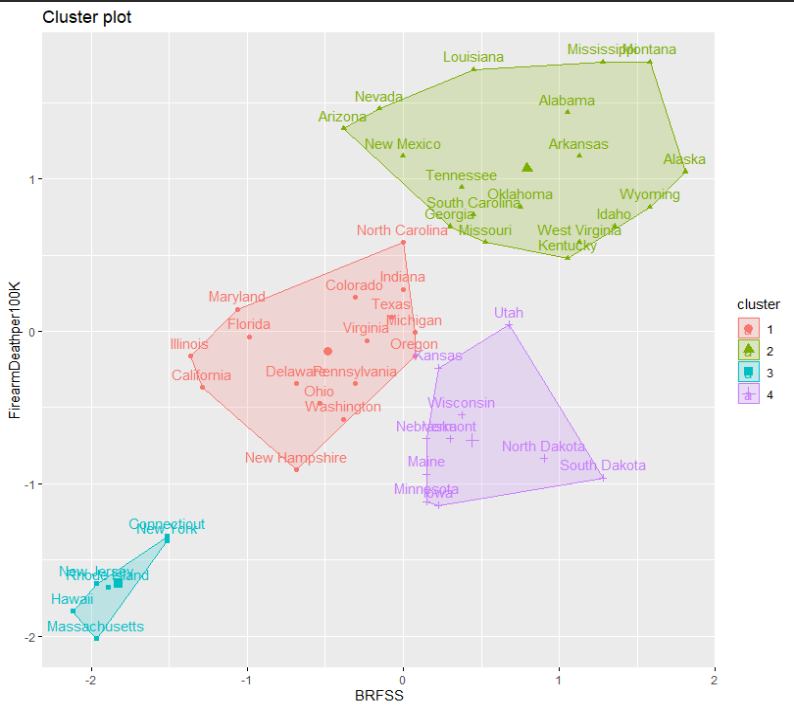
Demonstrating K-Means Clustering with Behavioral Risk Factor Surveillance System and CDC Gun Death Data
I demonstrated the implementation and optimization of K-Means clustering using gun ownership data from BRFSS and CDC gun death data. Rates of gun ownership closely correlate with gun deaths. Pictured are 4 clusters of states. An interesting follow-up question is whether the clusters have similar levels of firearm regulation.